Do you want to add a Query Monitor to your WordPress website? If so, then you’re in luck because the Query Monitor plugin does just that. A Query Monitor is a debugging tool that helps you monitor the back end of your website. This tool will help you catch and fix performance issues that are plaguing your website or help prevent them from happening.
For your website to work properly, it must make requests to the server. A Query Monitor will monitor these requests and notify you if something is wrong. This is an extremely useful tool for experienced web developers to take advantage of. Today, I will demonstrate how to install the Query Monitor plugin in WordPress and what it can do.
What is the Query Monitor Plugin Capable of
A Query Monitor is a debugging tool that helps you monitor and troubleshoot problems on the back end of your website and has a large number of tools. Here are some of the features the plugin includes:
- Hooks
- Scripts & Styles
- Languages
- HTTP Requests
- User Capability Checks
- Redirects
- Environment Information
A more detailed description of what the plugin offers can be found on the Query Monitor plugin page. Keep in mind that if you are not entirely sure what some of these terms mean, then you might not find this plugin helpful. It is designed for more experienced web developers.
How to Install Query Monitor in WordPress
Today, I will demonstrate how to install the Query Monitor plugin in WordPress and what it can do. This plugin offers a lot of features and I will try to cover what all of the major ones do and where to find them. To fully utilize the plugin, you will need some knowledge of how a website works and what some terms mean. If you are new to WordPress and web development in general, then this plugin might not be of any use to you until you get more experience.
Installing and Locating the Query Monitor Plugin
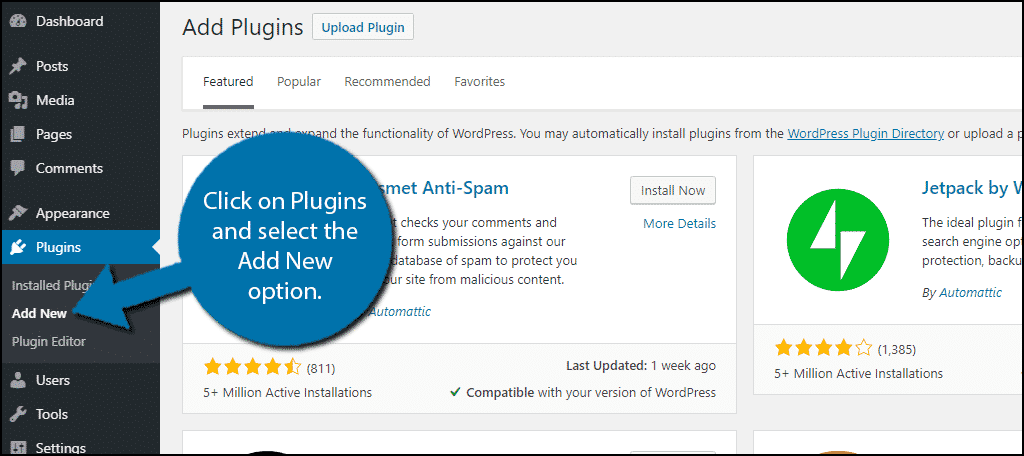
Start by clicking on Plugins and selecting the Add New option on the left-hand admin panel.
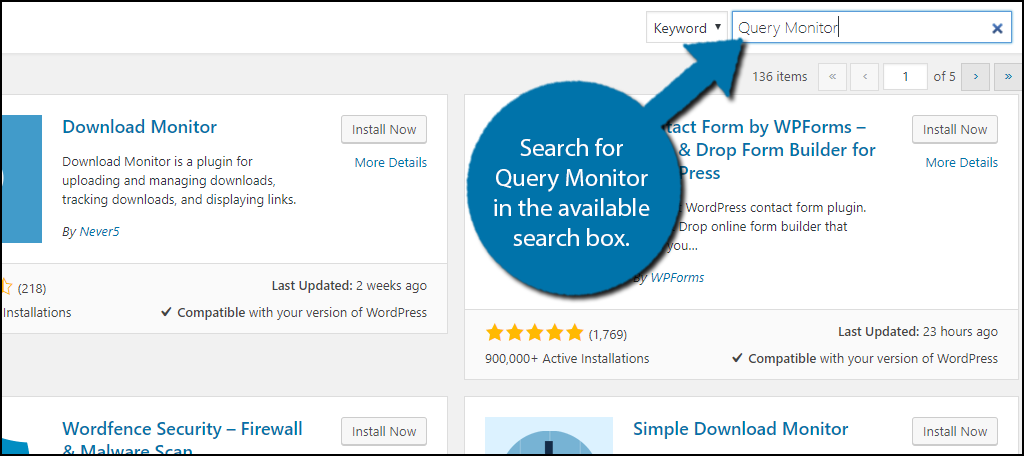
Search for Query Monitor in the available search box. This will pull up additional plugins that you may find helpful.
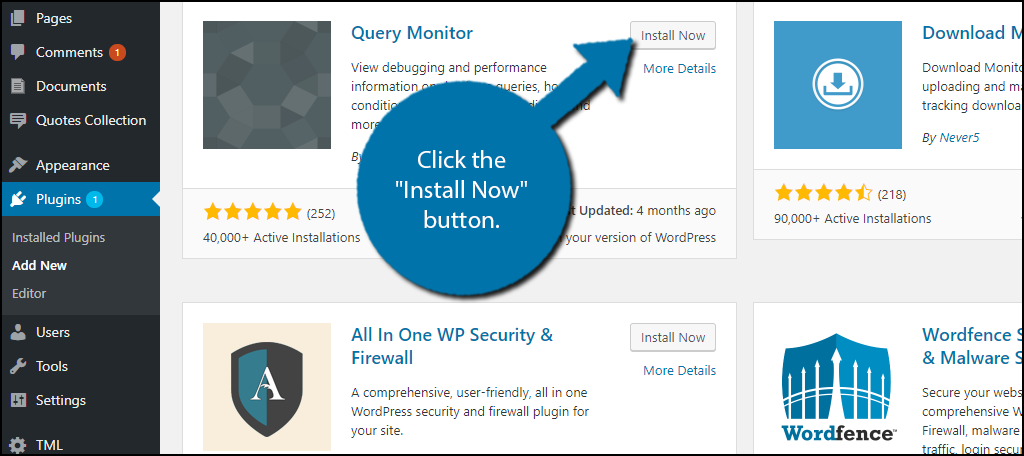
Scroll down until you find the Query Monitor plugin and click the “Install Now” button and activate the plugin for use.
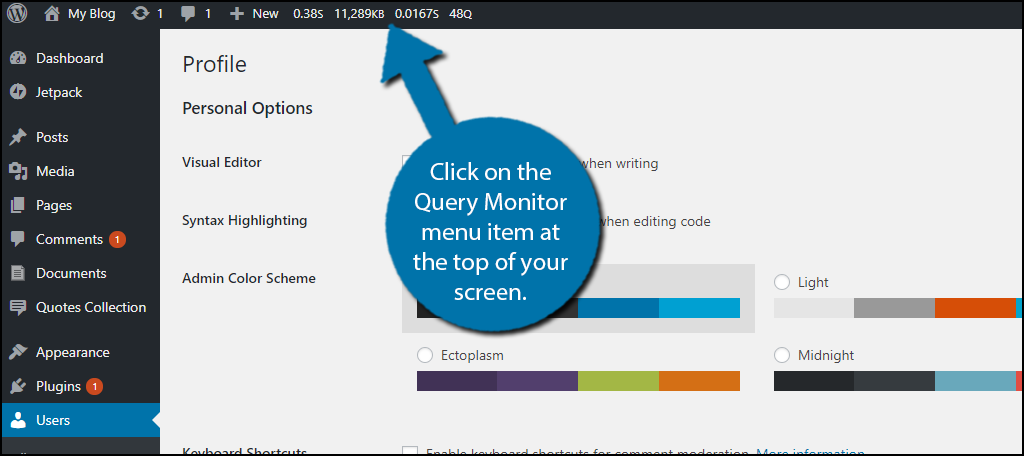
You should now see the Query Monitor menu at the top of the admin bar. If you do not, then you do not have the toolbar turned on. On the left-hand admin panel, click on Users and select the Your Profile option.
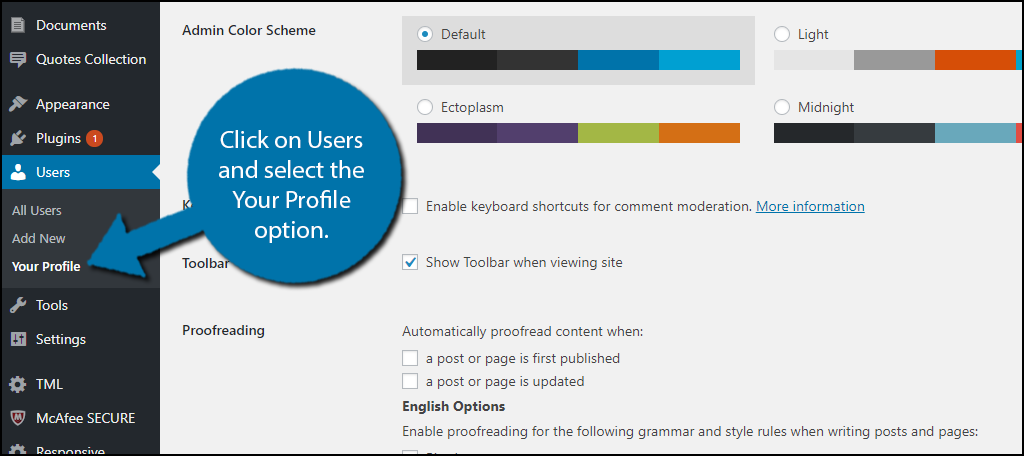
Make sure the “Show Toolbar when viewing site” checkbox is checked. and update the settings. Click on the Query Monitor menu item at the top of your screen.
I will now briefly go through the various tools the plugin offers and where to find them.
Queries
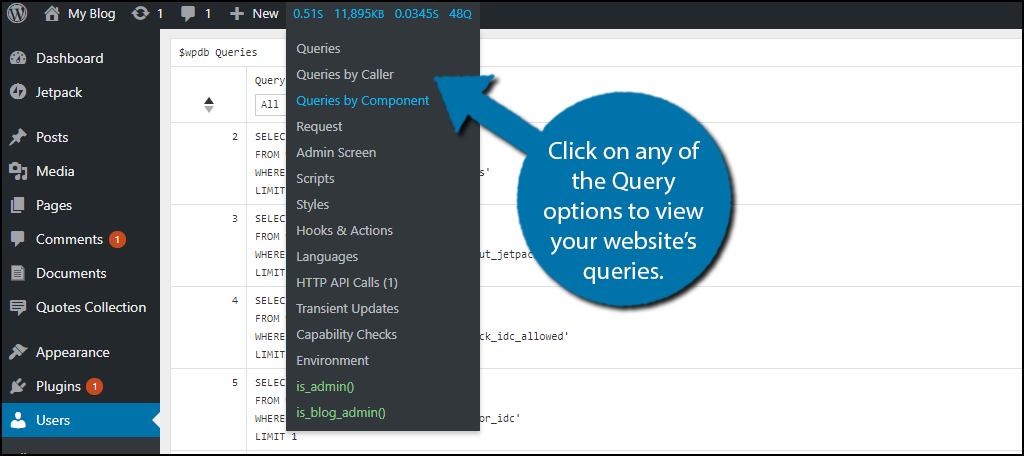
The main reason to use the Query Monitor plugin is to monitor your website’s queries. There is a lot of information available on your website’s queries. The plugin breaks queries into three menu items called Queries, Queries by Caller, and Queries by Component. The Queries options will show all of your website’s queries, but this list can get very large on larger websites. This is why there are two other options to use.
Queries by Caller will show you all your queries that are called and specifically who called them by custom code and where the code is located. Queries by Component will show you all of the queries that your plugins, themes, and WordPress core files are making.
Scripts and Styles
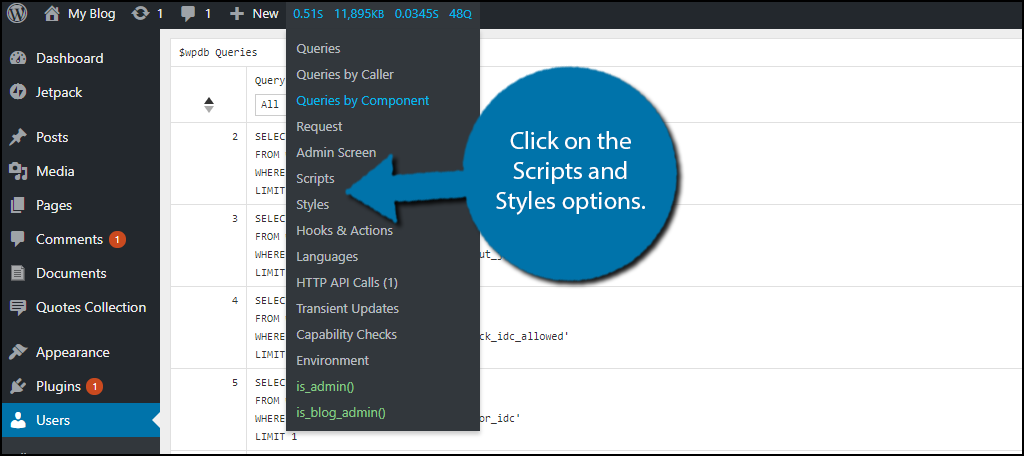
These two options will allow you to view the various Stylesheets and Javascript your themes and plugins are loading. Specifically, you can see where these are loaded and track where they are located.
Hooks & Actions
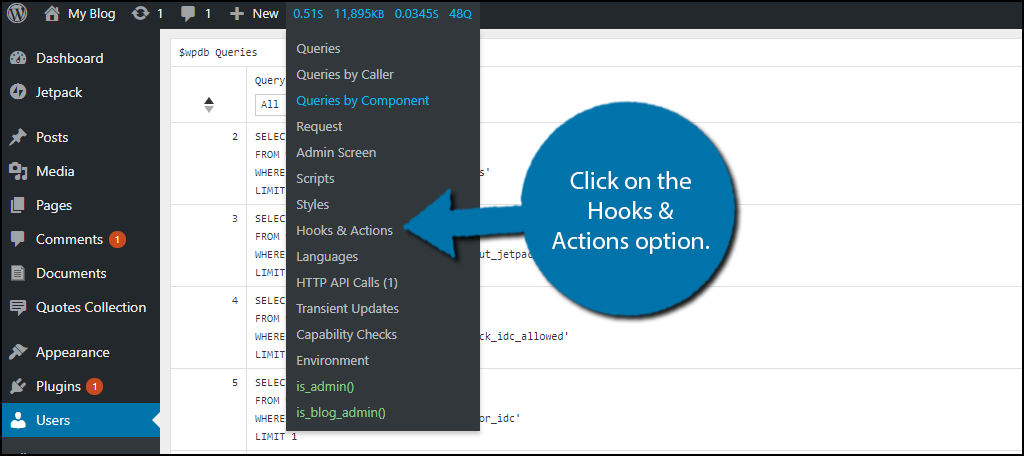
Here you will be able to monitor all of the Hooks that are being run on your website. You will also be able to see all of the actions that are triggered by these hooks.
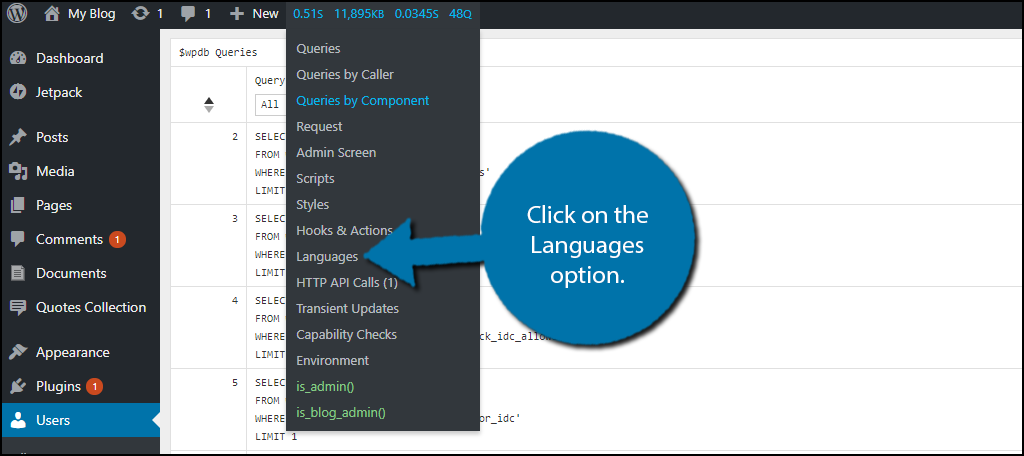
Languages
The world is a big place and not everyone speaks the same language. This is a problem for websites that want to attract visitors from around the world. Thankfully WordPress has many plugins to help you build a multilingual website. This option of the plugin will help you track where and which language files are being requested and loaded into.
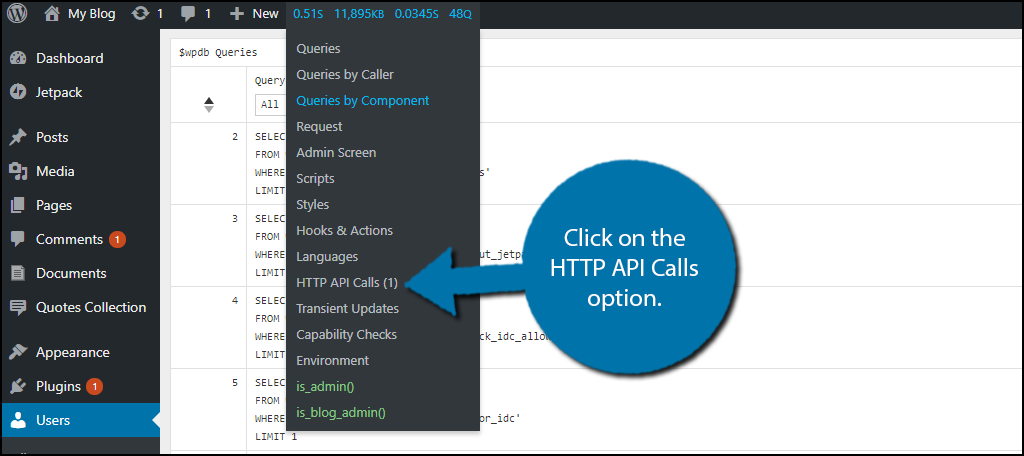
HTTP API Calls
This will display all third-party API calls being made on your website. For example, Jetpack showed up for me in this section.
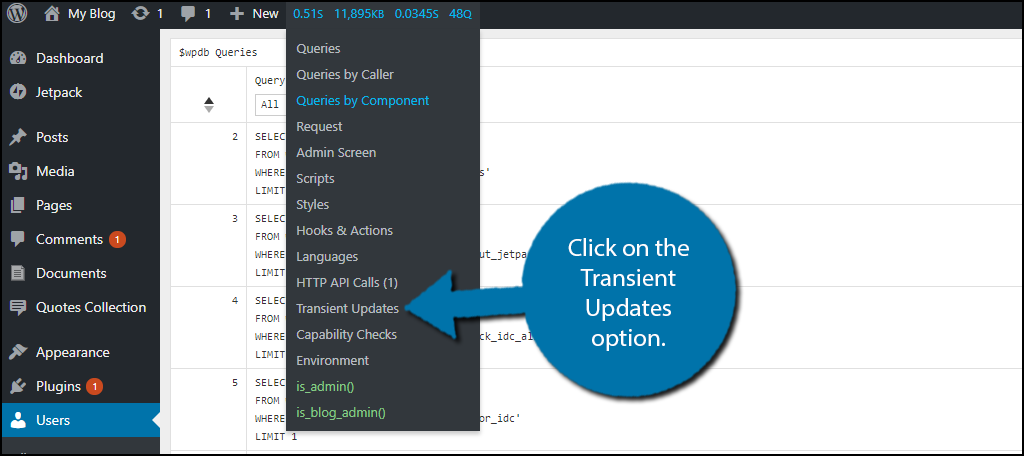
Transient Updates
Transient updates are updates that have an expiration date. This means they are temporary and will disappear once that expiration date is reached. You can view all of your website’s transient updates here.
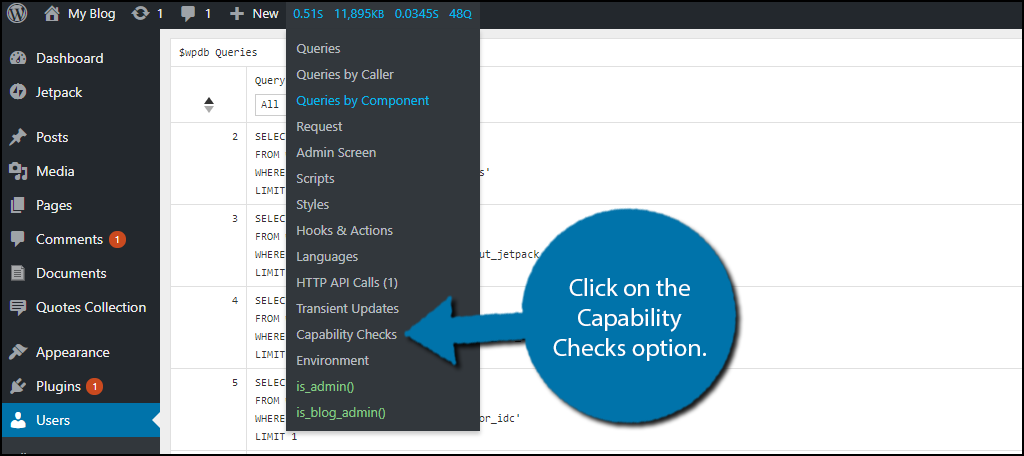
Capability Checks
This section will show you all your user role capabilities. More specifically if they have access to a certain core file, plugin, or theme.
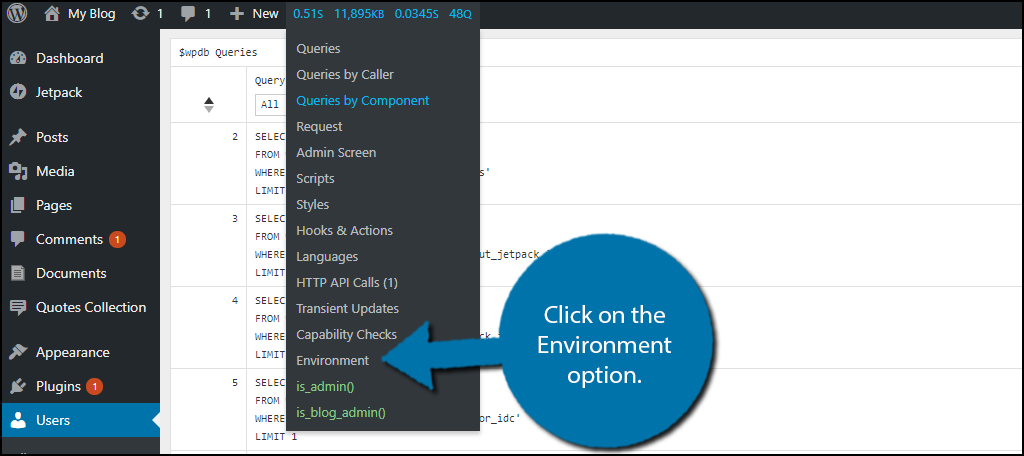
Environment
This section will show you all of your website’s hosting environment information. The environment refers to things like PHP version, Database names, etc.
Keep Track of Your Website
There is a lot of information to keep track of as a web developer. It can be a bit overwhelming at times, but plugins like Query Monitor make it easy to track important information. This can help you discover issues before they become a bigger problem. It can also help you locate ways to increase your website’s performance. Of course, you do need to have knowledge of web development to make full use of this plugin.
What is your favorite part of the Query Monitor plugin? What are you closely monitoring in your website?
